
Southeast Michigan August 2016 Summary
Comparing August to July, inventory of available homes dropped as the market has moved past its peak season. The number of August new pending sales (which will be our September and October closings) was up. Closed dollar per square foot fell off slightly in the under-$500k markets, but was up for homes with closed prices above $500k.
Dropping inventories combined with increasing new pending sales naturally led to a reduction in Months Supply of Inventory… on paper. That assumes that there will continue to be the same number of active buyers. A more likely explanation is that as summer was drawing to an end, there was an extra rush of new pending sales as buyers who have been looking through the summer finally pulled the trigger so that they can get settled in before the weather turns. In Michigan, we have four distinct seasons that impact our real estate cycles. Looking at the Monthly Closed Sales chart (below) for the past two years of Southeast Michigan sales, we can see distinct and inverse cycles of closed sales and days on market. The timing of the cycles will vary depending on various economic factors, but the cycles are fairly consistent with the number of closed units dropping off and market times increasing during winter months. Sellers who want to avoid being on the wrong side of the curve would do well to sharpen their detailing and pricing to compete for the limited number of buyers.
Fall and winter buyers may have fewer homes to pick from, but sellers may be more flexible in their negotiations. Smart buyers and their agents will utilize that advantage.
TRID’s Impact on Transaction Time
So that we can plan and advise our clients regarding timing when they are writing or considering offers, it may help to review the impact TRID has had on the time it takes to get from an accepted offer through the closing. Last year at this time there were significant concerns regarding projected closing delays that would be caused by the implementation of the newly required consumer protection regulations that added steps and potential delays to the closing process.
The TILLA-RESPA Integrated Disclosure rule (TRID) went into effect in October 2015. TRID was enacted by the Consumer Financial Protection Board with the intent of ensuring buyers had ample time (a minimum of 3 days) to review their numbers in closing documents prior to closing the sale. If there were changes to the numbers, the required time of three days would reset. With that consumer benefit came an increased potential for delays that buyers and sellers could not waive. Those delays could throw off the scheduling of other buyer/seller activities (i.e. movers, or the closing of properties that sellers were purchasing).
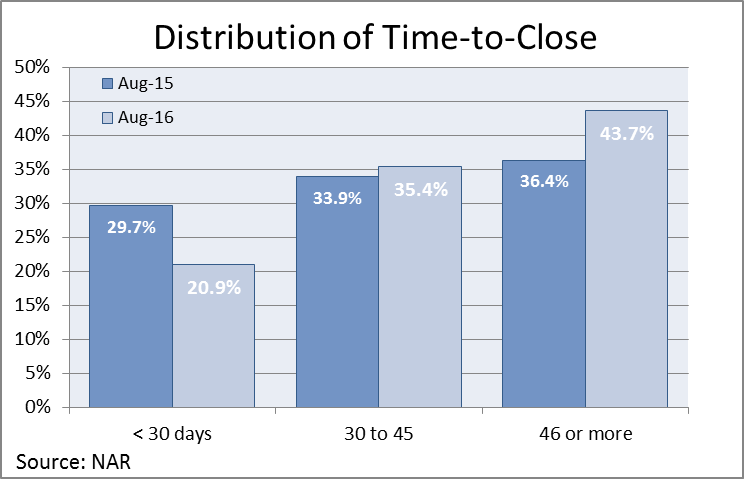
According to the National Association of REALTORS®, from August 2015 to August 2016, the time required to get from acceptance of an offer to closing increased by 4 days. Nationally, only 21 percent of closings happen within 30 days of the acceptance of an offer, 35 percent happen in the 30-45 day window and 44 percent take 46 days or more to close. We looked to see how pending date to closing numbers looked locally. There has been little difference when comparing samples of August 2015 closing times to recent August transaction times. It appears local agents, lenders and title companies have worked well to minimize delays. By planning and responding quickly to requests for information, few local buyers and sellers have been impacted by TRID delays.