
October 2016 Market Report
Southeast Michigan
Predicting the Next Housing Bubble
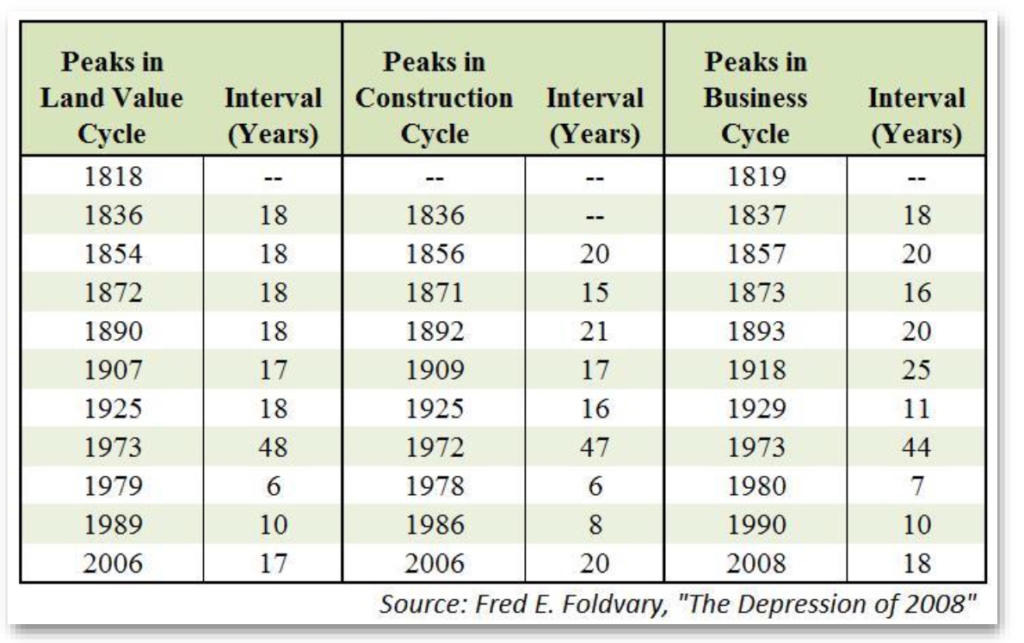
The 2008 recession took most by surprise. In hindsight, understanding the phases that make up a typical real estate market cycle should give us insight to where our market will move in the future. In his article How to Use Real Estate Trends to Predict the Next Housing Bubble , Teo Nicolais, a Denver real estate entrepreneur and teacher of a real estate investment strategy course at Harvard Extension School, describes four phases that make up market cycles.
These market cycles have been recurring in the US at roughly 18-year intervals since 1800 and follow four phases/quadrants.
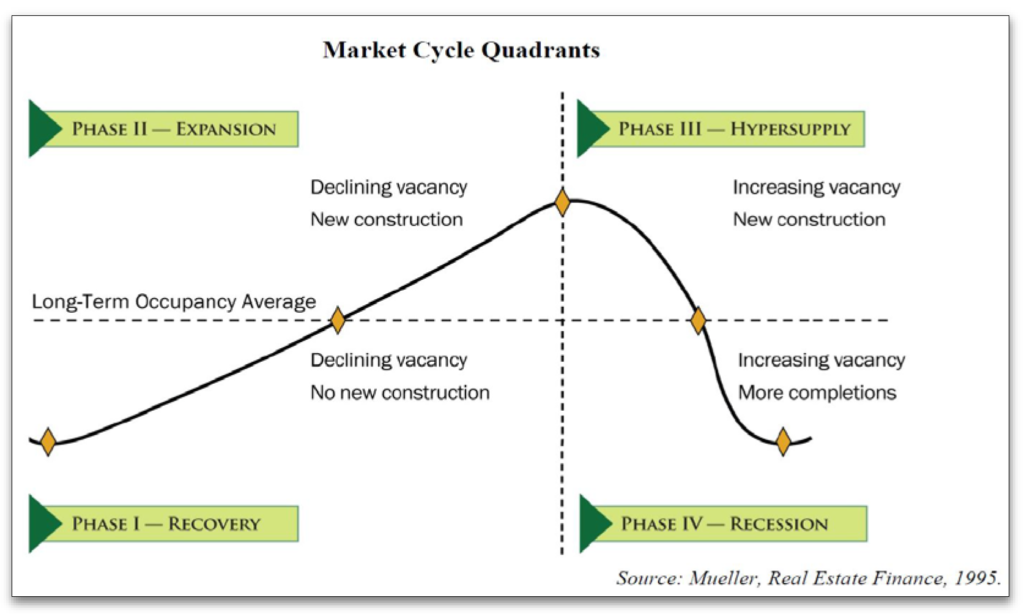
Phase I
Recovery is marked by a jump in demand. In an effort to promote investment, interest rates are artificially held low by the government. Consumer confidence recovers, even if household incomes remain flat, spurring demand that had been held up during the recession.
Phase II
Expansion begins when the cheap buildings have been bought up by both investors and homeowners, reducing inventories and causing both rents and home values to jump. Increasing equities created by increasing values allow more sellers to sell and builders to build new housing (both owner occupied and rentals). Often toward the end of this phase, investors and builders begin to over build, speculating on buildings and land to meet the jump in demand. While anticipating further rent and value growth, buyers often overpay, chasing the fast moving market and developing properties ahead of demand.
Phase III
Hypersupply is the result of the over development. Both vacancy rates and unsold real estate inventory rise. (Nicolais calls this “the first indication of trouble”). In this phase, the rate of rent and property value growth begins to decelerate as supply catches up with demand. Many of those long-term development projects from Phase II are caught in the middle of construction.
Phase IV
Recession is marked by occupancy levels falling below long-term averages and the Feds trying to fight off inflation by increasing interest rates. Development stops and home sellers begin discounting prices to adjust to the falling demand.
Where are we in our current cycle?
We are early in Phase II, the expansion phase of this cycle. The cheap properties have been bought up. Rents and values are rising. Real estate inventories and interest rates remain low and new construction activity is back up. If we use the 18-year point of reference, the next housing recession would be due around 2024. This, of course, is dependent on a number of other domestic and international economic factors.
Should there be a recession in the next 8 to 10 years, the housing portion of the economy should outperform the rest, since housing will go into any slowdown with a good balance of supply and demand. In the meantime, be aware of the markers in the various phases— speculation driving up prices, over supply with vacancies and unsold homes. You could say that some of those markers exist today, particularly with prices being driven up in some ultra hot markets. However, even in the hottest markets, we are just now moving past the 2006 peak values, and with historically low inventories, we are clearly in the beginning stages of the recovery phase for most price ranges. We are keeping an eye on the upper-end markets above $500,000 to see if the current slow down is a temporary adjustment to a recovering market or a longer term slowing market trend.
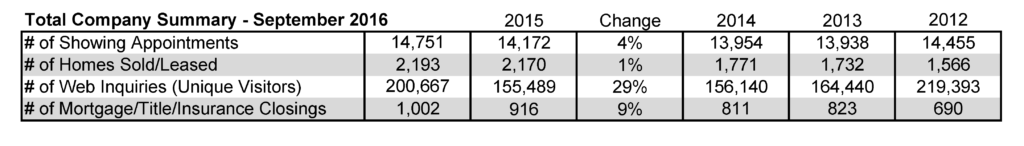
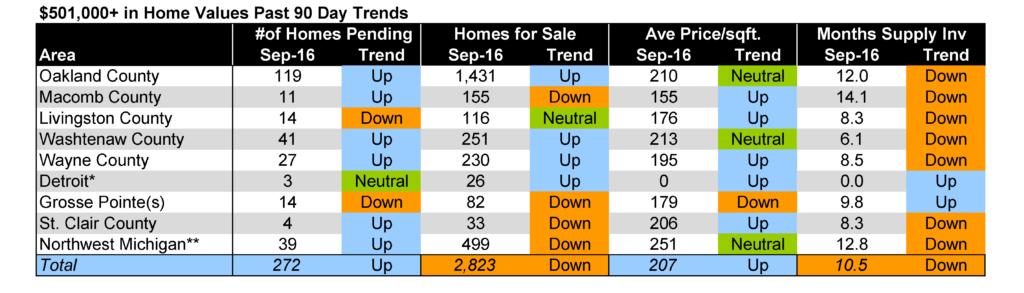
Quick Southeast Michigan 3rd Quarter Summary
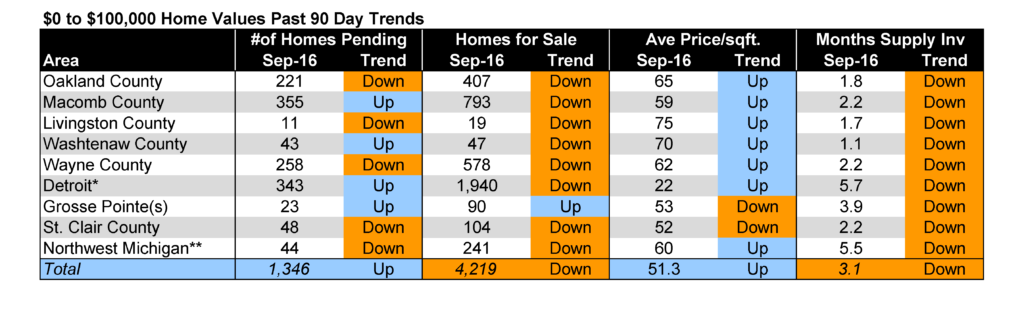
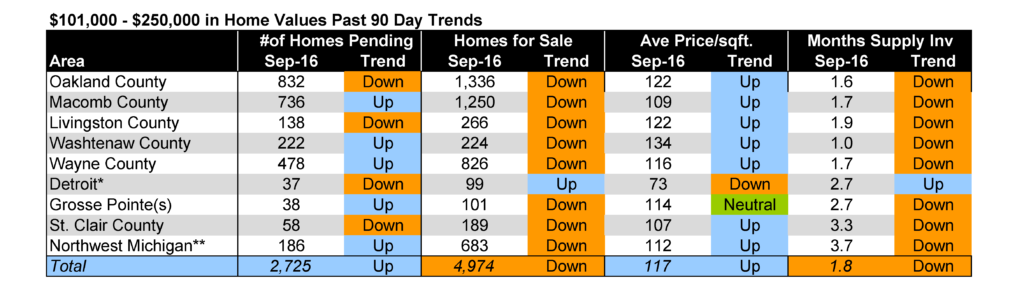
While there is variation within market areas and price ranges, overall, inventory levels are down and dropping in most areas and price ranges— with more in the lower and mid-price levels, and less in higher price ranges.
Sales activity is down in the under-$250k range, in large part due to the lack of available inventory as many of the bargain priced homes that were available in the past few years are gone.
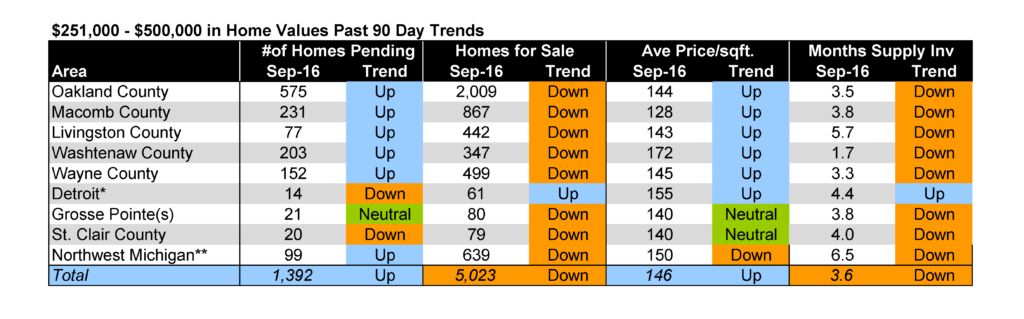
With about a four month supply of inventory, the $250-$500k market is balanced. Values, as indicated by closed dollar per square foot, are up about five percent since last year—modest/healthy growth.
With 10+ months of inventory, dropping sales rates and declining values, higher-end markets tend to favor buyers. Despite high levels of available inventory, high-end buyers are still having trouble finding the “perfect” homes they are looking for… and they are looking for perfect homes with everything done.
While 2016 has been a great year for real estate, most markets appear to be slowing down and flattening to a more balanced pace of activity and growth. Upper-end markets have slowed the most. While the market is still relatively strong, much of the inventory could use a little polish to capture the interest of buyers who are ready to move when they see the right home.
The extremely low interest rates shouldn’t be taken for granted. At some point we’ll be hearing, “Remember when you could get a mortgage with an under four percent rate?” Being aware of market opportunities helps us make/counsel good decisions.
![]()