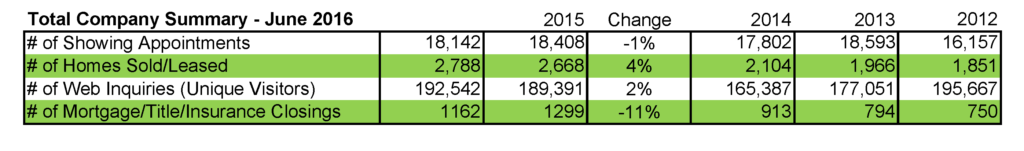

The summer of 16′ has followed the same trends as the winter and spring, with inventories remaining tight across all markets under $500,000, particularly in the $100,000-$250,000 segments. Sales are up in most markets above $100,000, as are new listings entering the market, which might start to give some relief to buyers frustrated with their home search. About one third of homes sold were on the market for 10 days or less, while the majority of homes (50%) remained for 30 days or less. Thus, it is clear that properties priced well, and in the best condition, are still selling in days or weeks, as opposed to months. For the under $250,000 price points about 50% are selling for equal to or above asking price. For the $250,000-$500,000 markets, about 30% are selling at or above asking price, and for the over $500,000 homes, it’s about 25%. The vast majority of those sales at or above asking price are occurring within the first 30 days across all price ranges.
While overall 2nd Quarter market activity was up slightly in most markets and down slightly in a few, values as measured in “Price per Square Foot” ($/SF) were up in all Southeast Michigan markets, (several by 30%) compared to the 2ndQuarter of 2015.
Oakland County
The number of Oakland County homes sold in June 2016 was up 14% over May 2016 and was about the same as last June. June values (as indicated by closed $/SF) were 24% higher than they were a year ago.
In comparing the 2nd Quarter of 2016 to the 2ndQuarter of 2015, units were up slightly and values were up 22%. There are less than 2 months of available inventory in all price ranges under four hundred thousand (400k). Going up in price, the $400k-$600k market has 3 months of inventory, the $600k-$1 million market has 6 moths, and the over $1 million market has 11 months. In the 2nd Quarter of 2016 $/SF in the over $1 million market increased 39%, from $234/SF to $342/SF over the same period last year.
Macomb County
In June 2016 Macomb sales were up 5% over May 2016 but down 8% from a year ago. This June’s values were up 6% over last month’s and 12% over June 2015.
During the 2nd Quarter of 2016 units were about the same as last year but values were up by about 10% in most price ranges, and 3% in the over $500k range. Overall, Macomb homes have been taking a little longer to sell with “Days on Market” (market time) increasing by 11% to 68 days, compared to 62 days for the 2nd Quarter of 2015.
Livingston County
The number of Livingston County homes sold in June 2016 was about the same as in June 2015 but $/SF jumped by 31%.
For 2nd Quarter 2016 units were up 5% compared to the same quarter of 2015, and 2ndQuarter values rose 30% over the 2nd Quarter of 2015. Houses remained on the market an average of 77 days (up from 71 days in 2015).
St. Clair County
June 2016 closed sales were up 34% over May 2016, and 15% over June 2015. June 2016 $/SF rose 11% over June 2015.
Sold units were up 5% in the 2nd Quarter of 2016 compared to the same period in 2015. $/SF was up 9% in that same period, but sales took 20% longer as market time increased to an average of 121 days. The number of homes sold in the $200-$300k range was 26% higher, and the homes which sold for over $300k averaged 56% higher per $/SF than during the 2nd Quarter 2015.
Wayne County (excluding Detroit and Grosse Pointe)
The number of June 2016 closed sales in Wayne County was up 19% over May 2016 and 5% over June 2015. At $111.22 June’s closed $/SF was up 35% over that of a year ago and market times dropped by 5% (1.8 MSI).
In comparing the 2nd Quarter 2016 Wayne County sales to the same time last year, Closed Units rose 7%, Values rose 31% and Market Times dropped 5%. The number of $500k+ units sold in this quarter remained the same at 78 units but $/SF in this price segment rose by 34%, and market times dropped 34% to 87 days (4.9 MSI).
Detroit
The number of Detroit homes/condos sold in June 2016 was up by 9% over the number sold a year ago. The average $/SF overall went up by only 2%. Three quarters of the available Detroit units are priced below $50k where there is about 6 Months Supply of Inventory (MSI). In Detroit, MSI drops as we go up in price range, with 2.3 MSI, and only 75 available properties listed for over $250k.
Looking at 2nd Quarter sales, 49% more (61) homes sold in the over $250k range and they sold for 46% more ($150.66 $/SF) than they did in the 2nd Quarter of 2015. They also sold in 37% less time (44 days).
Grosse Pointe
June 2016 closed sales were down 5% from a year ago but $/SF and market times were up 4% and 6%, respectively.
2nd Quarter Grosse Pointe closings were off pace by 3% compared to the 2nd Quarter of 2015, but prices were up by 5%. There were more sales in the $300-$500k range, and about 15% fewer sales in the over $500k price ranges. The 12 homes which sold for over $800k in the 2nd quarter averaged $199/SF compared to 14 homes and $210/SF in the 2nd Quarter of 2015.
Downriver Area
Downriver saw some great numbers in June. Along with a 7% increase in closed sales for this June compared to May 2016, there was an 11% increase in units and a 49% $/SF increase, compared to June 2015.
Downriver’s 2nd Quarter of 2016 closed sales were up 13%, $/SF was up 32% and market times were down 20%. Those numbers are fairly consistent through all price ranges.