
This summer continues to be good for real estate sales throughout the county and for local Southeast Michigan real estate, in particular. In discussing the 2016 summer market, Jonathan Smoke, realtor.com’s chief economist said, “The best spring in a decade has transitioned into the hottest summer in a decade”, and went on to name two Southeast Michigan markets, Detroit (ranked 13th) and Ann Arbor (ranked 20th), on realtor.com’s July’s Hottest Markets List. Smoke attributes the strong summer performance to a combination of tight inventory, pent up demand and low interest rates. For a link to the realtor.com article written by Cicely Wedgeworth, go to: http://www.realtor.com/news/hottest-real-estate-markets-july-2016/
Southeast Michigan July 2016 Summary
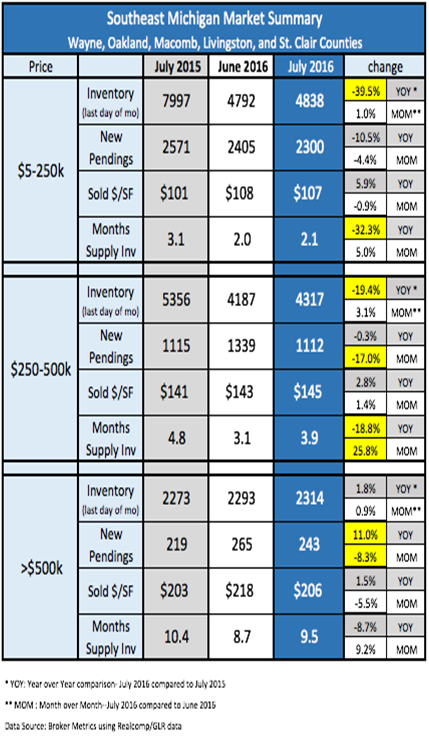
Inventory levels remained fairly stable going from June to July, but were down over 40 percent in the less-than-$250k market compared to July 2015 and also down 20 percent in the $250-500k price range.There was no real change in the over- $500k range. Due in large part to seasonality, July versus June new pending sales were down across all price ranges. They dropped 16 percent in the $250-500k range and 14 percent for homes priced over-$500k. Expect to see some bouncing and late summer activity spurts, but the market is slowing. Compared to June, July sold dollar per square foot was up 1.4 percent in the $250-500k market, but it dropped in both entry and high-end price segments. Months Supply of Inventory is also building in all price ranges. It will continue to do so as new listings enter the market faster than pending sales remove them. Price July 2015 June 2016 July 2016 -39.5% YOY * 1.0% MOM** -10.5% YOY -4.4% MOM 5.9% YOY -0.9% MOM -32.3% YOY 5.0% MOM -19.4% YOY * 3.1% MOM** -0.3% YOY -17.0% MOM 2.8% YOY 1.4% MOM -18.8% YOY 25.8% MOM 1.8% YOY * 0.9% MOM** 11.0% YOY -8.3% MOM 1.5% YOY -5.5% MOM -8.7% YOY 9.2% MOM * YOY: Year over Year comparison- July 2016 compared to July 2015 ** MOM : Month over Month–July 2016 compared to June 2016 Data Source: Broker Metrics using Realcomp/GLR data $5-250k $250-500k >$500k Inventory (last day of mo) New Pendings Sold $/SF Months Supply Inv Inventory (last day of mo) Inventory (last day of mo) New Pendings 7997 4792 4838 2571 2405 2300 $101 $108 $107 3.1 2.0 2.1 5356 1115 $141 4.8 $203 Sold $/SF Months Supply Inv Months Supply Inv Sold $/SF New Pendings $143 3.1 4317 1112 $145 3.9 10.4 change Southeast Michigan Market Summary Wayne, Oakland, Macomb, Livingston, and St. Clair Counties 2273 2293 2314 243 $206 9.5 265 $218 8.7 219 4187 1339 Heading into the Fall 2016, expect to see the market slow as a result of both seasonality and the fact that the recovery run we’ve been experiencing the past several years is settling back into a more normal market. Higher price ranges will feel more of a market slowdown. Sellers who want to get the best return on the sale of their properties should pay attention to the details. Buyers want move-in ready homes and they are willing to pay more for them. Sellers should be aware of market movement in their area and price range. If competitive listings are moving and theirs isn’t, they may need adjustments in detailing or price, sometimes both. Buyers who aren’t finding what they are looking for (or had one get away in a competitive bid situation) may want to bump up their price range a little as they move into the post-prime market. Sellers with overpriced or under detailed listings often become more flexible as they move closer to year end. Great rewards are available for buyers who keep abreast of the trends so that they are ready to make quick decisions when opportunities present themselves.