
Southeast Michigan Summary
2016 Southeast Michigan Housing Numbers Up
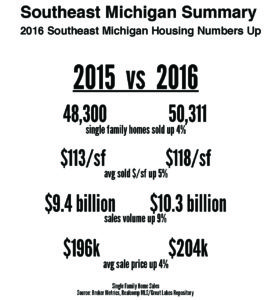
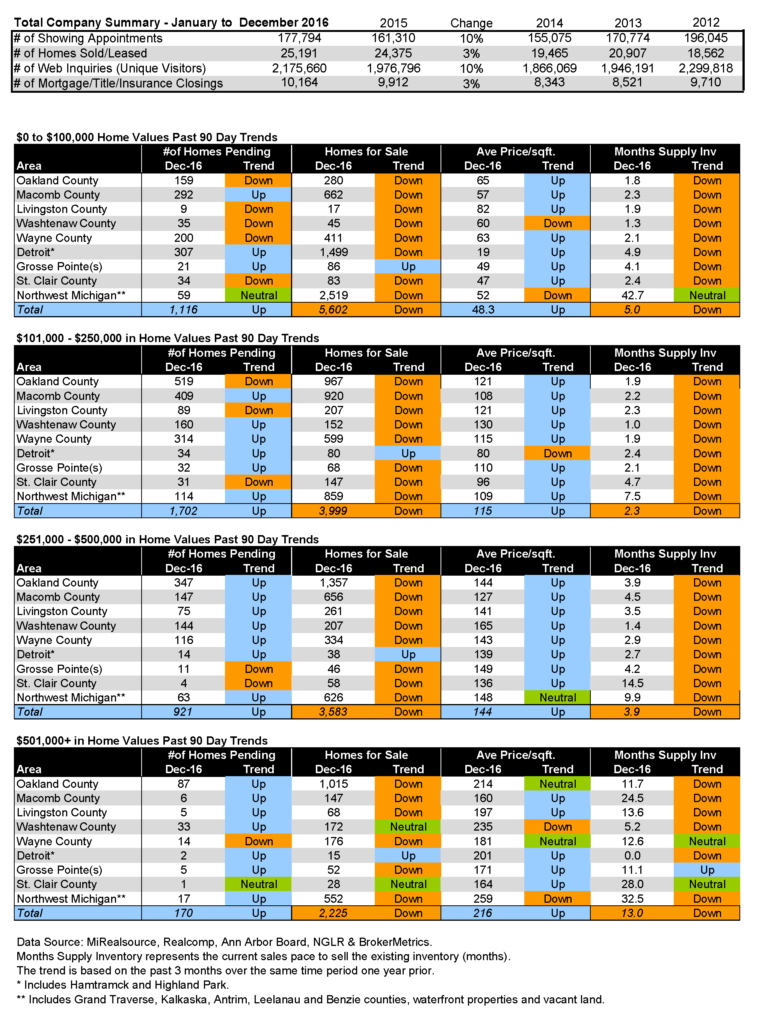
2016 was a great year for single family home sales in Southeast Michigan. Many factors including location, price range and condition affect the value of individual properties, but in general, the number of homes sold in 2016 was up by four percent and the average sales price was up by five percent compared to 2015.
With over 17 thousand single-family homes sold at an average price of $275k, Oakland County led with $4.8 billion in 2016 sales volume as reported through local multi-list systems. While more homes were sold in Wayne County, its dollar volume tallied $2.6 billion. Macomb County came in third with $2.1 billion in sales.
While some would like to see values rise a little faster, the more conservative growth we have seen over the past several years provides market stability.
In the Tri-County (Oakland, Wayne and Macomb) areas, appreciation rates have generally been flat for the luxury home markets compared to middle and lower price segments.
2017 Southeast Michigan Forecast
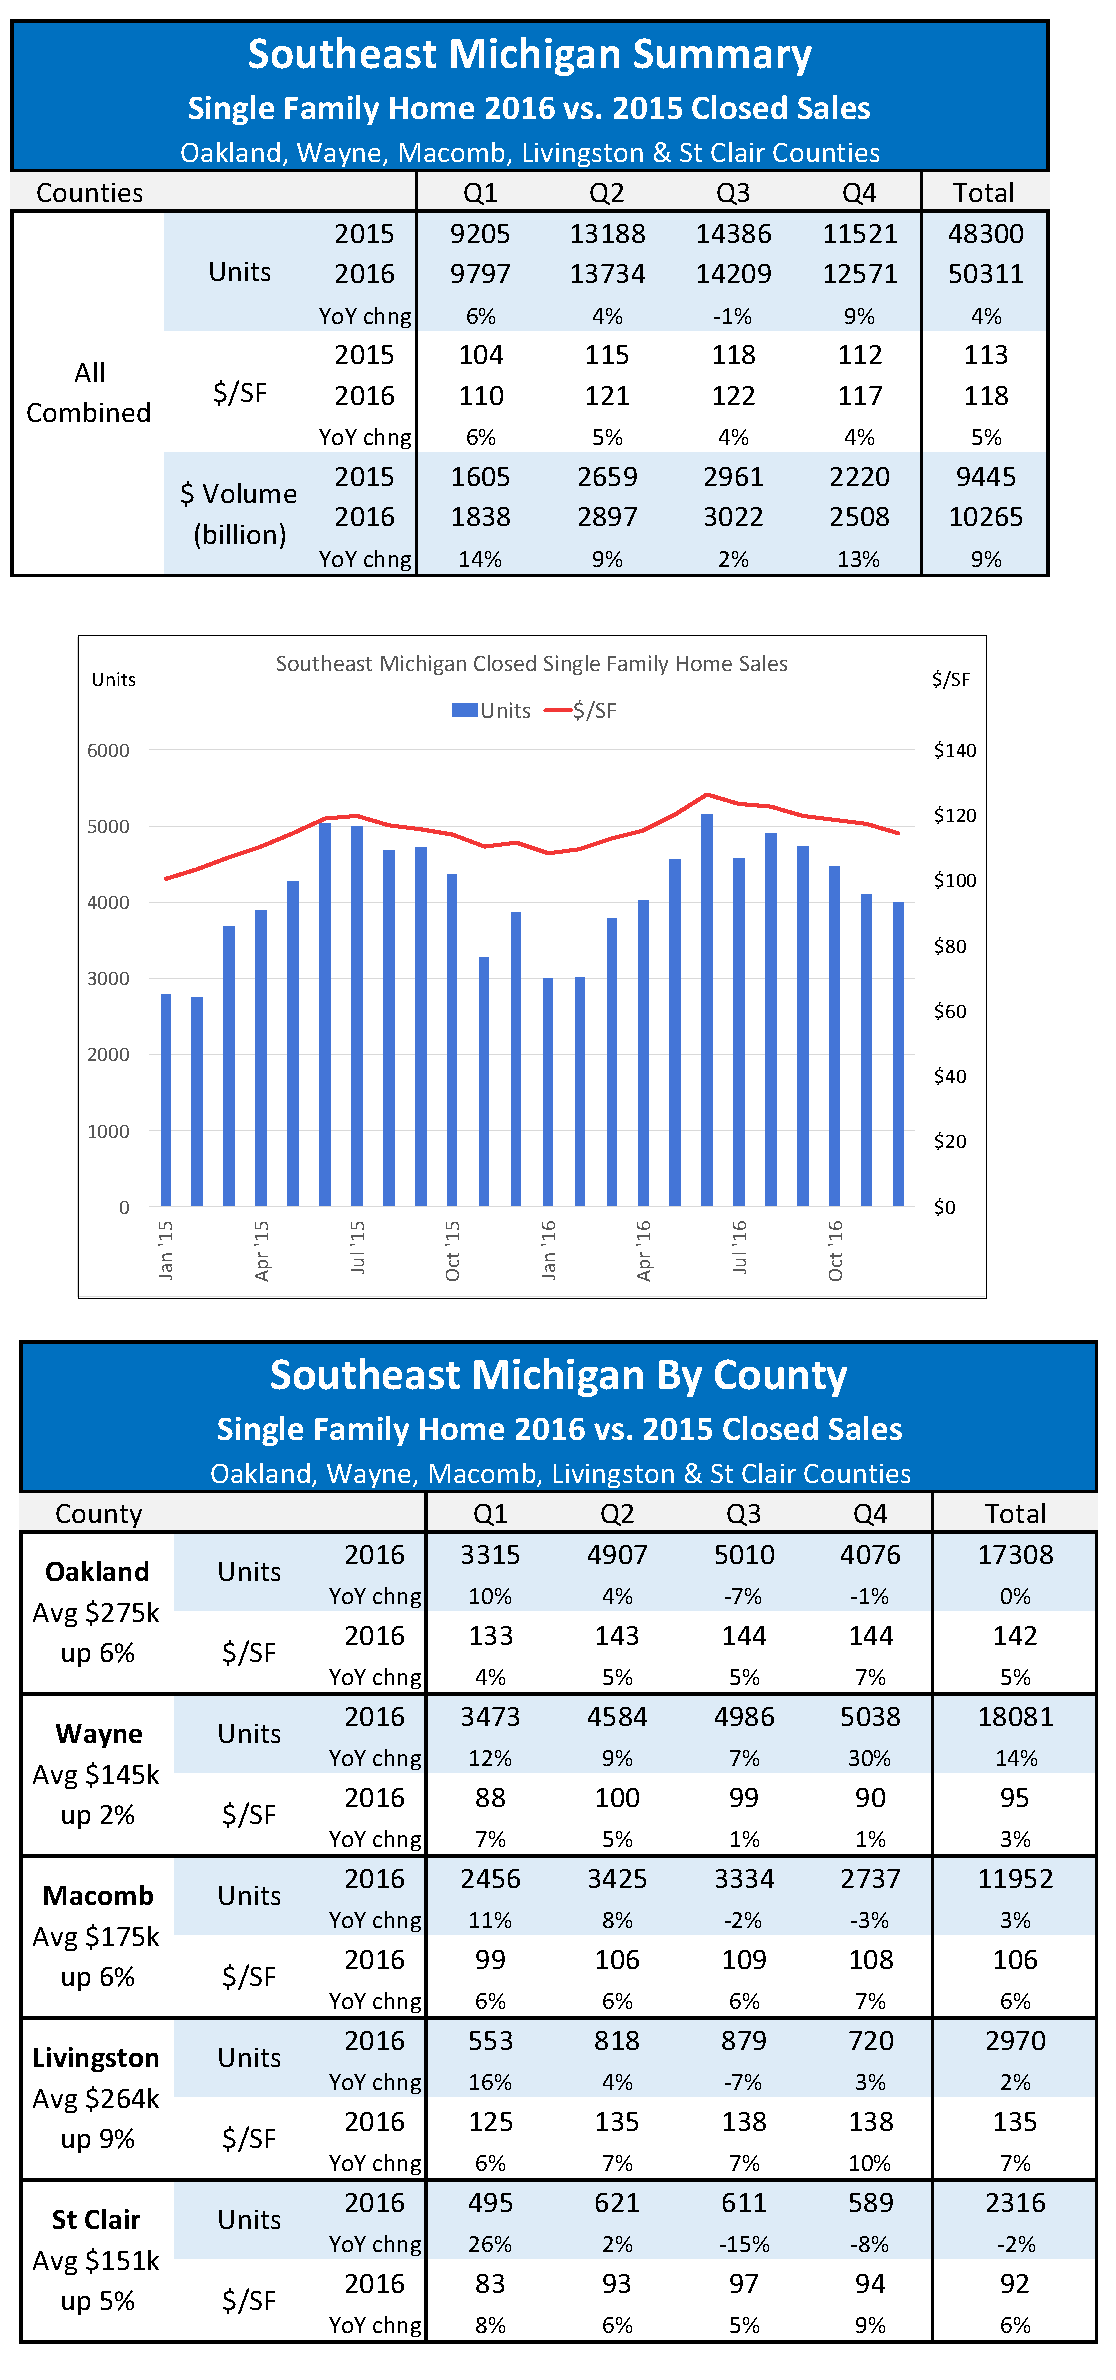
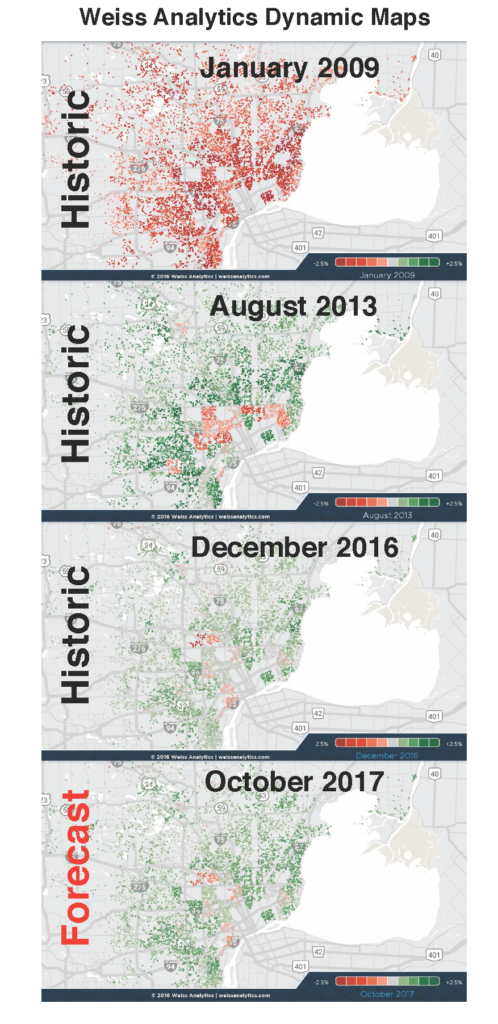
We are using Dynamic Maps to illustrate Metro Detroit market history and to make a forecast for 2017. Red indicates declining and green indicates increasing values. Gray is neutral. For comparison, we took a snapshot of a rapidly declining market (from 2009) and provided a shot of where we were with the recovery in 2013. We see both dark green and bright red in 2013.
December 2016 shows a more stable gray market with lots of light green and still a little red. We are in a fairly stable growth market with fewer extremes.
Weiss Forecast
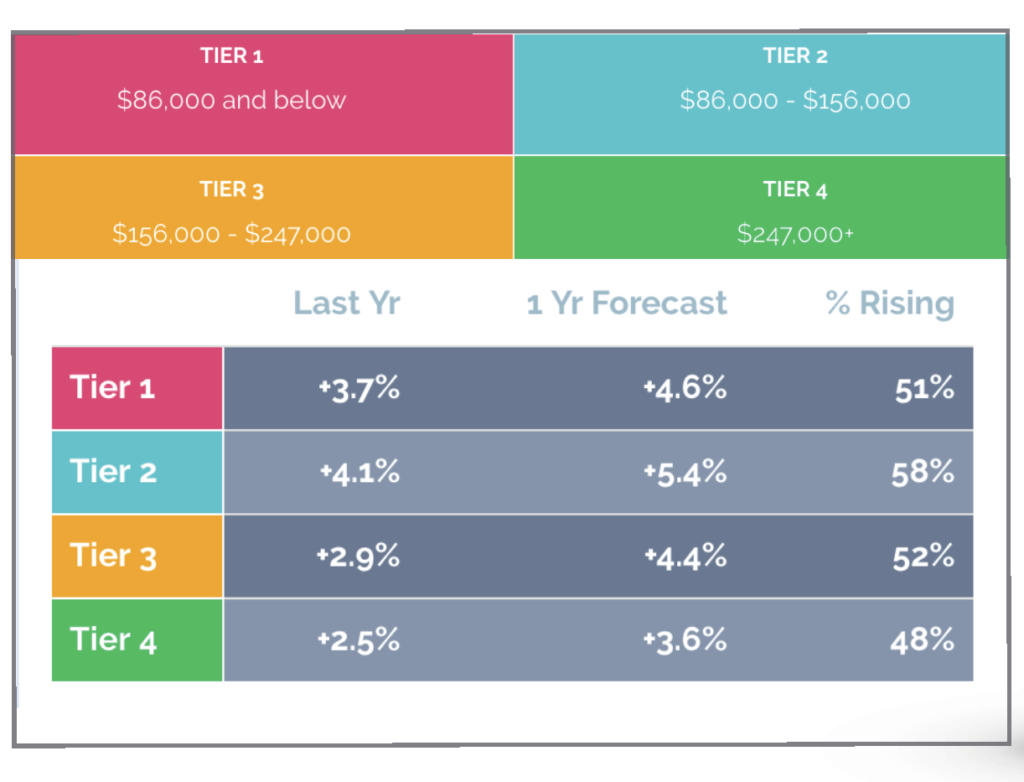
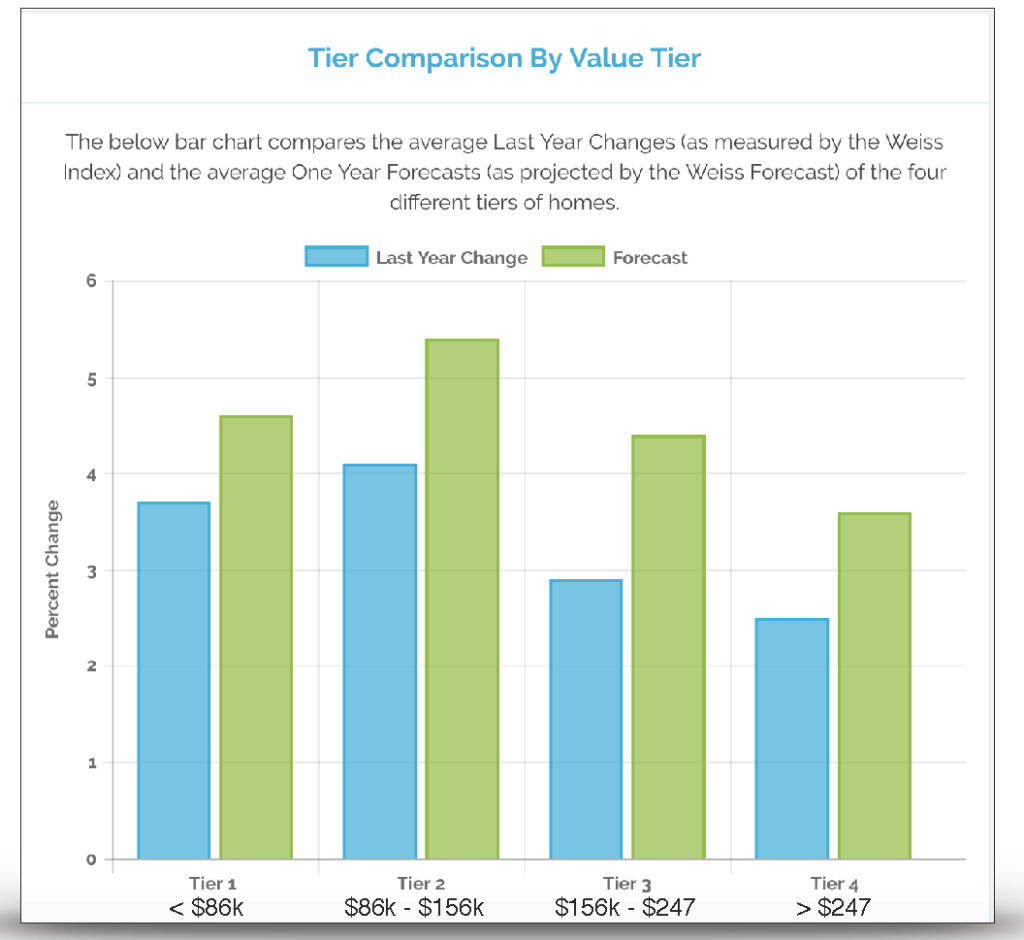
Weiss’s 2017 Dynamic Map shows more and brighter green, indicating a prediction of stronger performance. Weiss’s model breaks markets into four price tiers (equal sized quartiles). For Metro Detroit, those tiers are: Tier I <$86k; Tier II $86k-$156k; Tier III $156k-$247k; and Tier IV > $247k. Weiss’s model shows 2016 appreciation rates between 2.5% and 4.1%. For 2017, Weiss’s models are predicting appreciation rates of between 3.6% and 5.4%. Again, Tier II is expected to be the strongest with higher-end markets predicted to see lower rates of appreciation.
Each of Weiss’s Tiers are comprised of one quarter of the total sales or predicted sales. Grouping this way may hide the unique details of more specific price segments-especially on upper-end markets. For example, while the Weiss reports predict 3.6% value increases for Detroit Metro homes priced above $247,000, we are expecting little growth or even declining values for most homes priced above $500k.
Potential Rising Interest Rates have provided and will continue to provide urgency for buyers and sellers. Buyers can afford more home with lower rates and at a given price, more buyers can afford a seller’s home. Lower interest rates provide a benefit for everyone involved in a transaction.